Excel Helpdesk Dashboard
Excel Helpdesk Dashboard
The SyAM Excel Helpdesk Dashboard provides the manager with real time charts of key attributes of the Helpdesk ticketing data.
The Dashboard updates automatically when the file is opened. Additional filters enable views for specific locations or technicians or prior dates for historical charting.
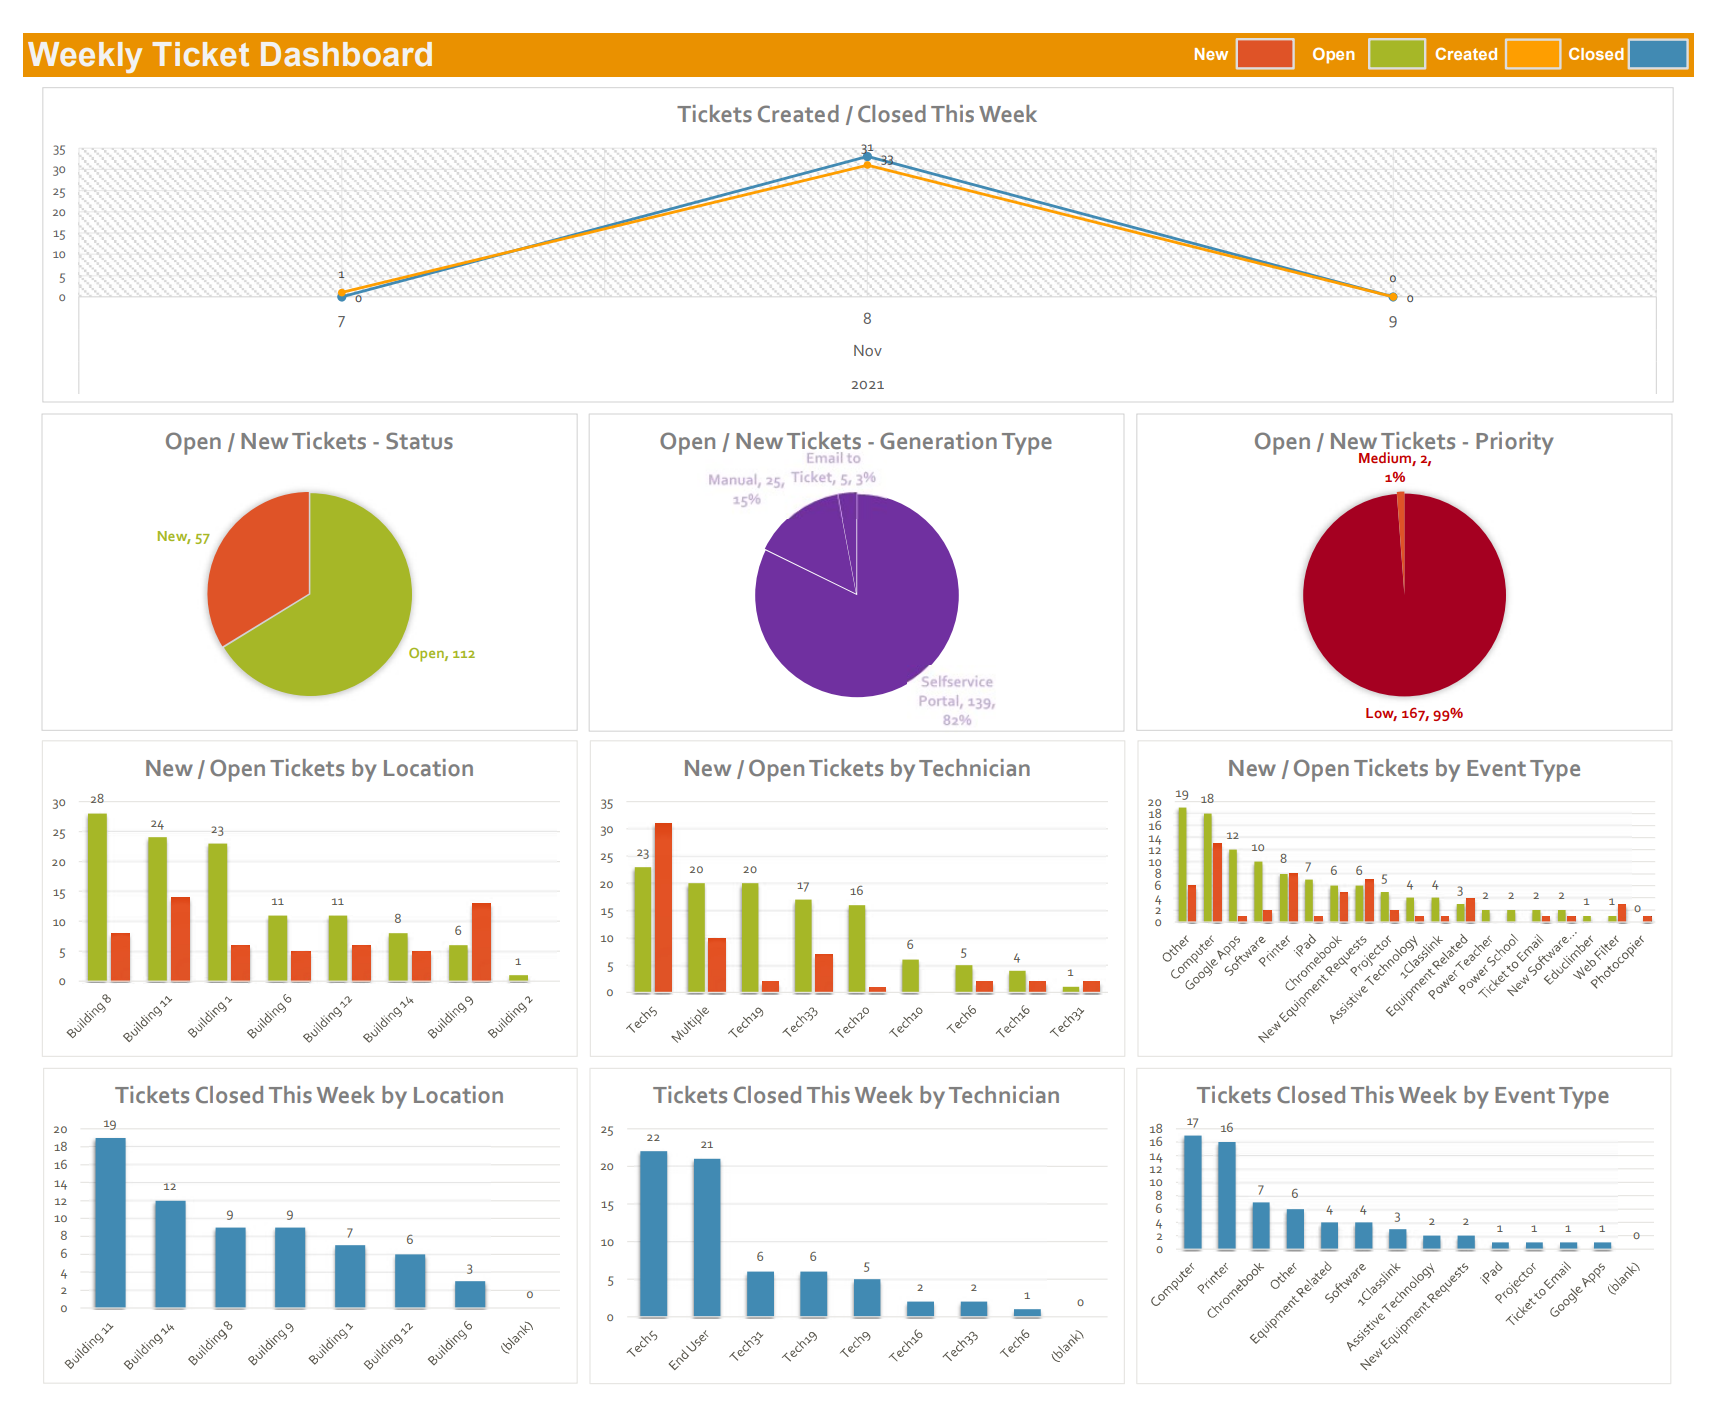
Weekly View
Line Chart - Comparison for the week of tickets created and closed.
Pie Chart – Status of New/Open / Generation Type of New/Open / Priority of New/Open
Bar Charts – Current New/Open Location / Weekly Closed Location / Current New/Open Technicians / Weekly Closed Technician / Current New/Open Event Type / Weekly Closed Event Type
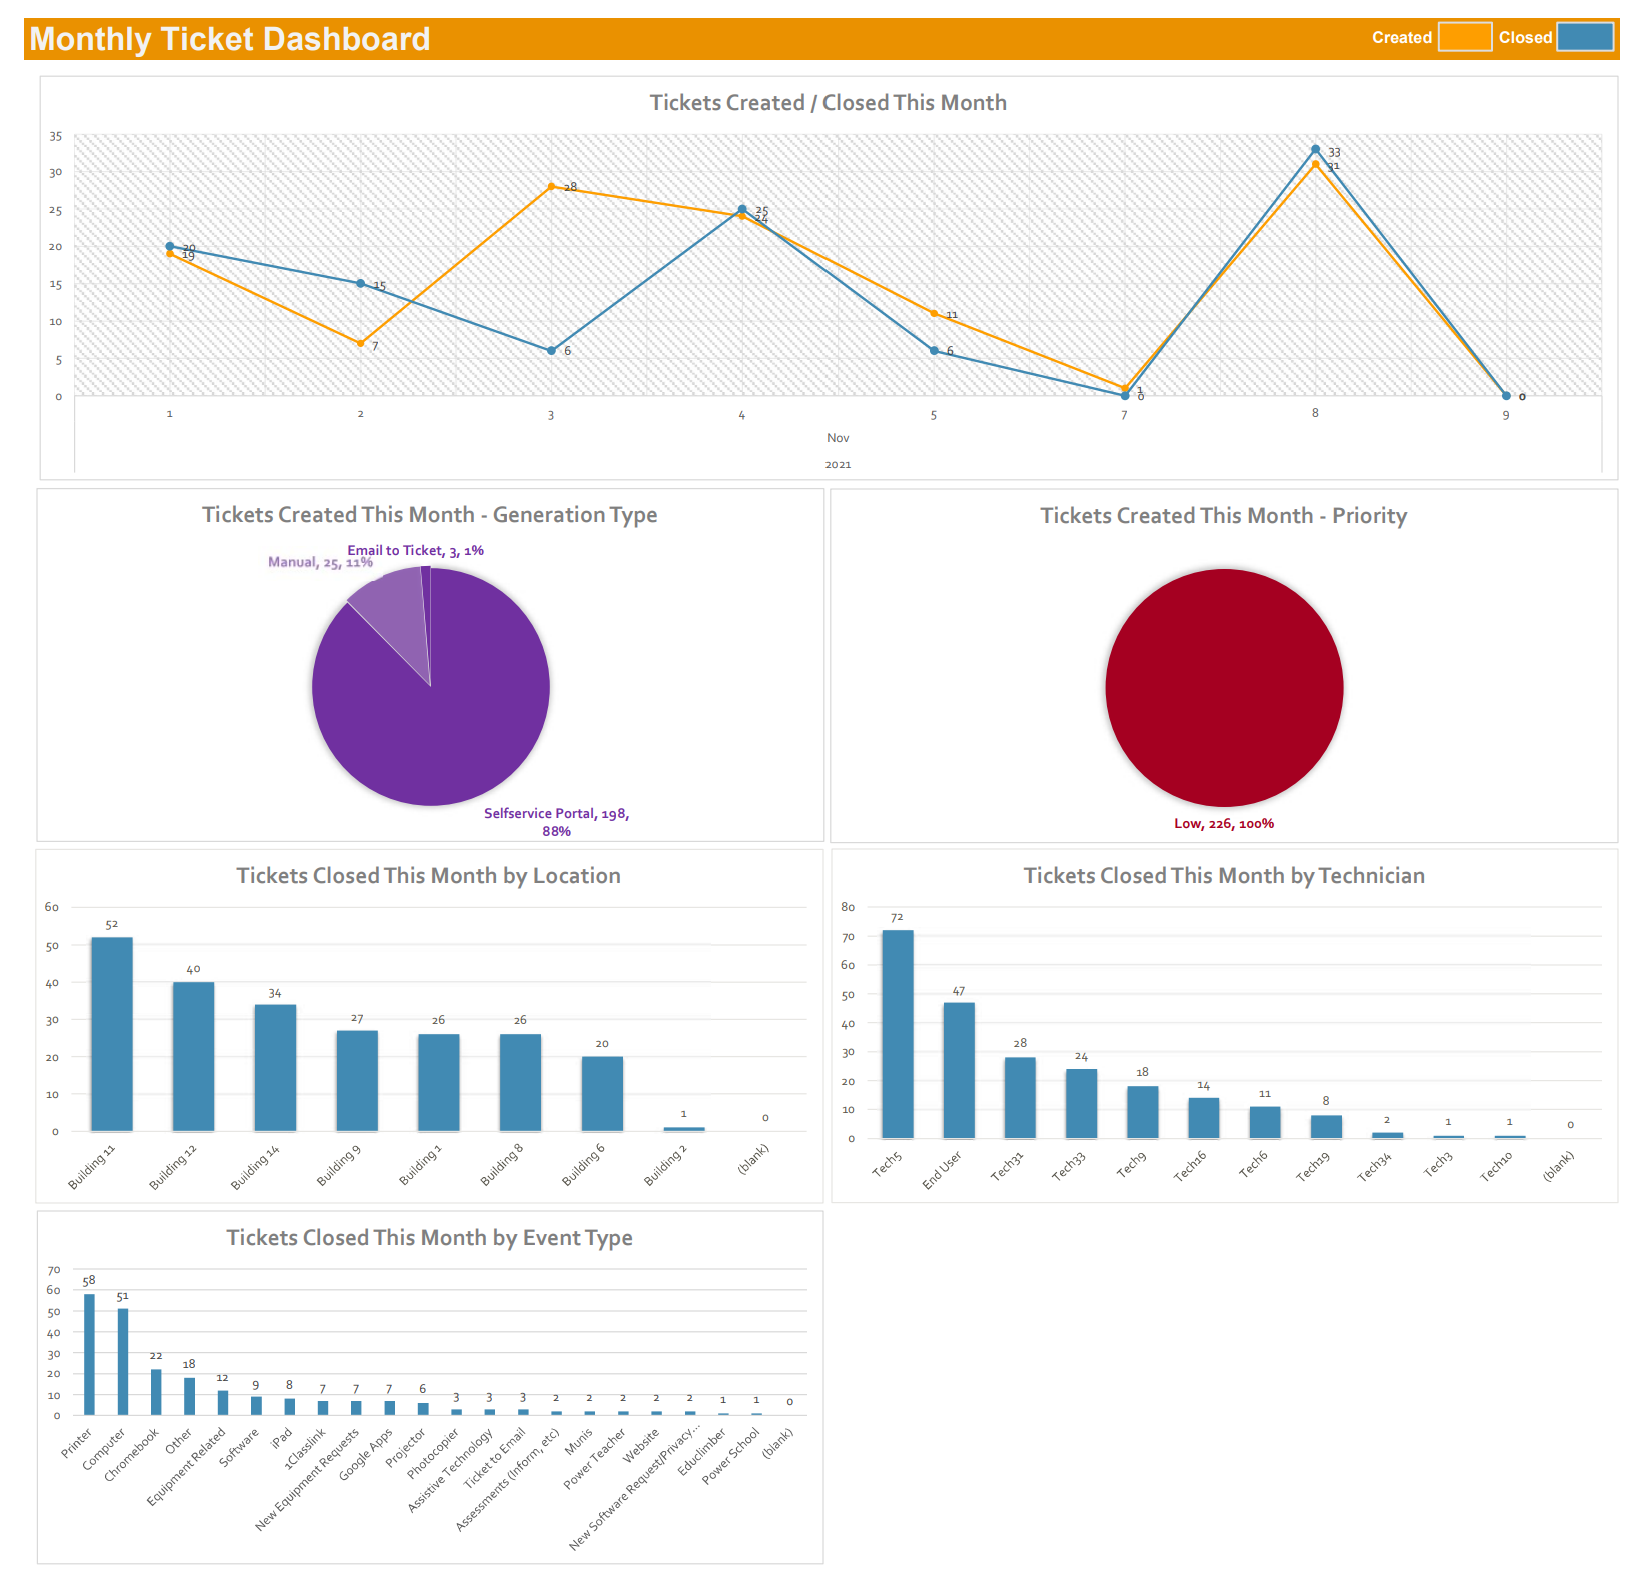
Monthly View
Line Chart - Comparison for the month of tickets created and closed.
Pie Chart – Generation Type of Tickets Created this month / Priority of Tickets Created this month.
Bar Charts – Monthly Closed Location / Monthly Closed Technician / Monthly Closed Event Type
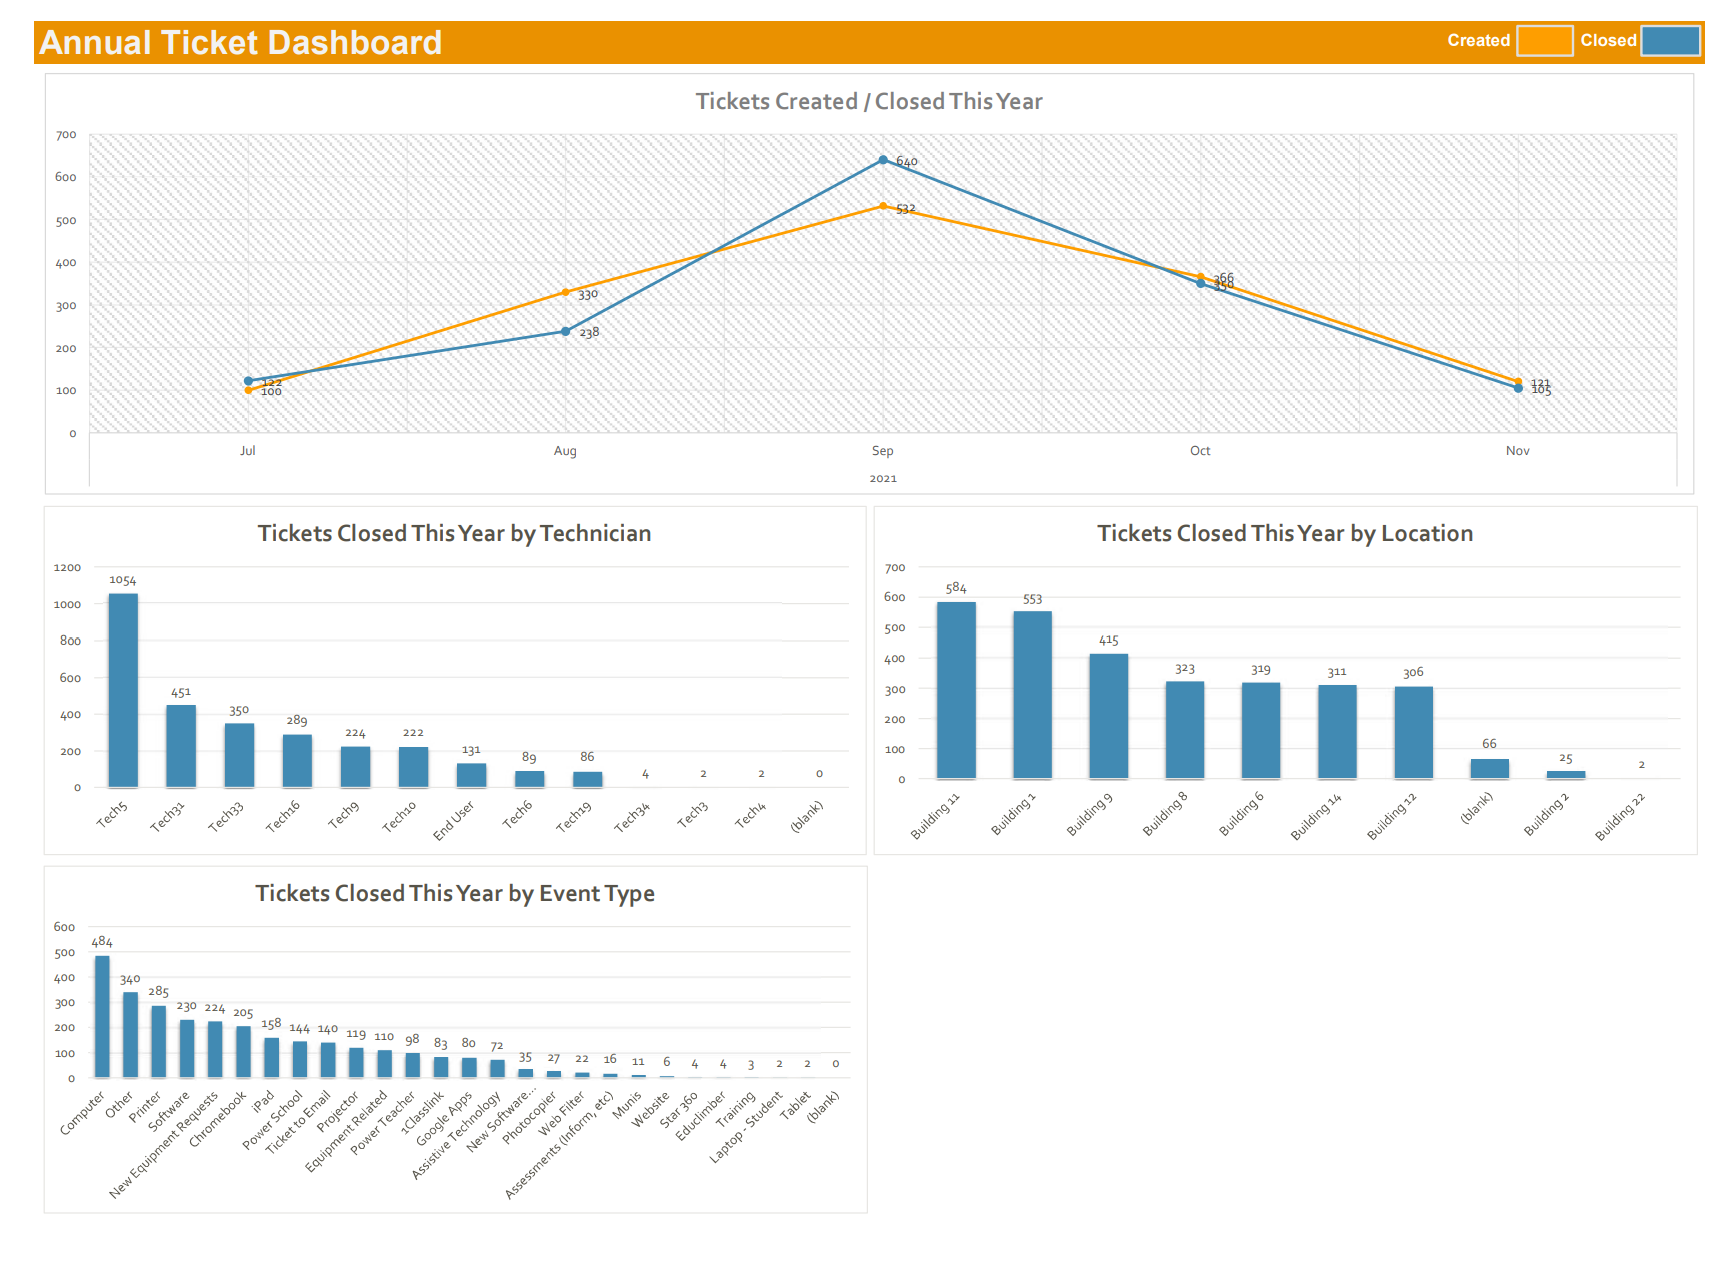
Annual View
Line Chart - Comparison for the year of tickets created and closed.
Bar Charts – Annual Closed Location / Annual Closed Technician / Annual Closed Event Type
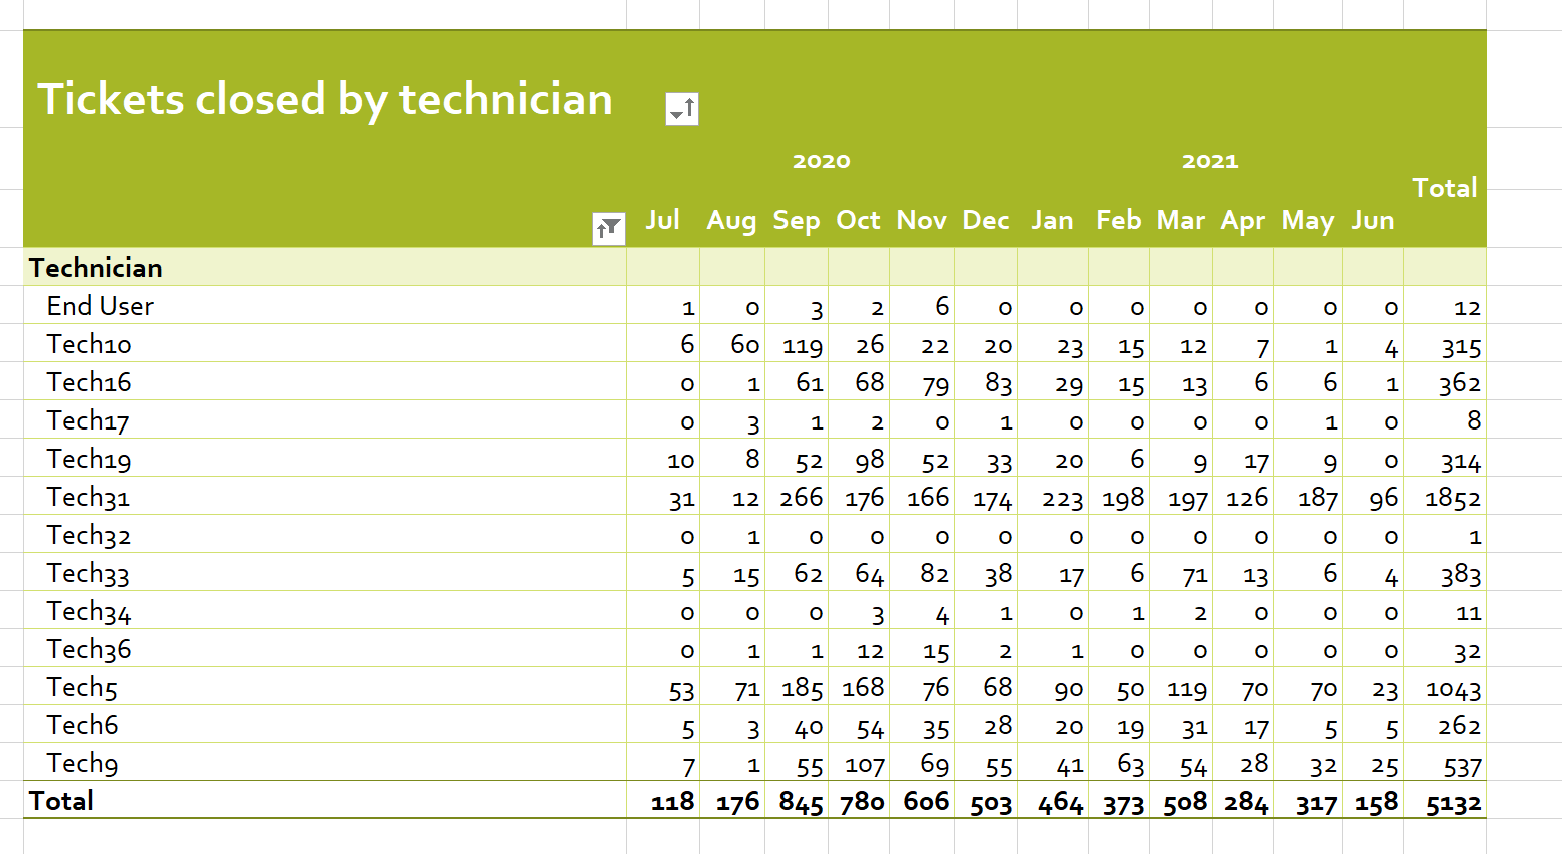
Tables – Tickets Closed by Technician
Presents the number of tickets closed each month by the different technicians.
Tables – Tickets Closed by Location
Presents the number of tickets closed each month by the different locations

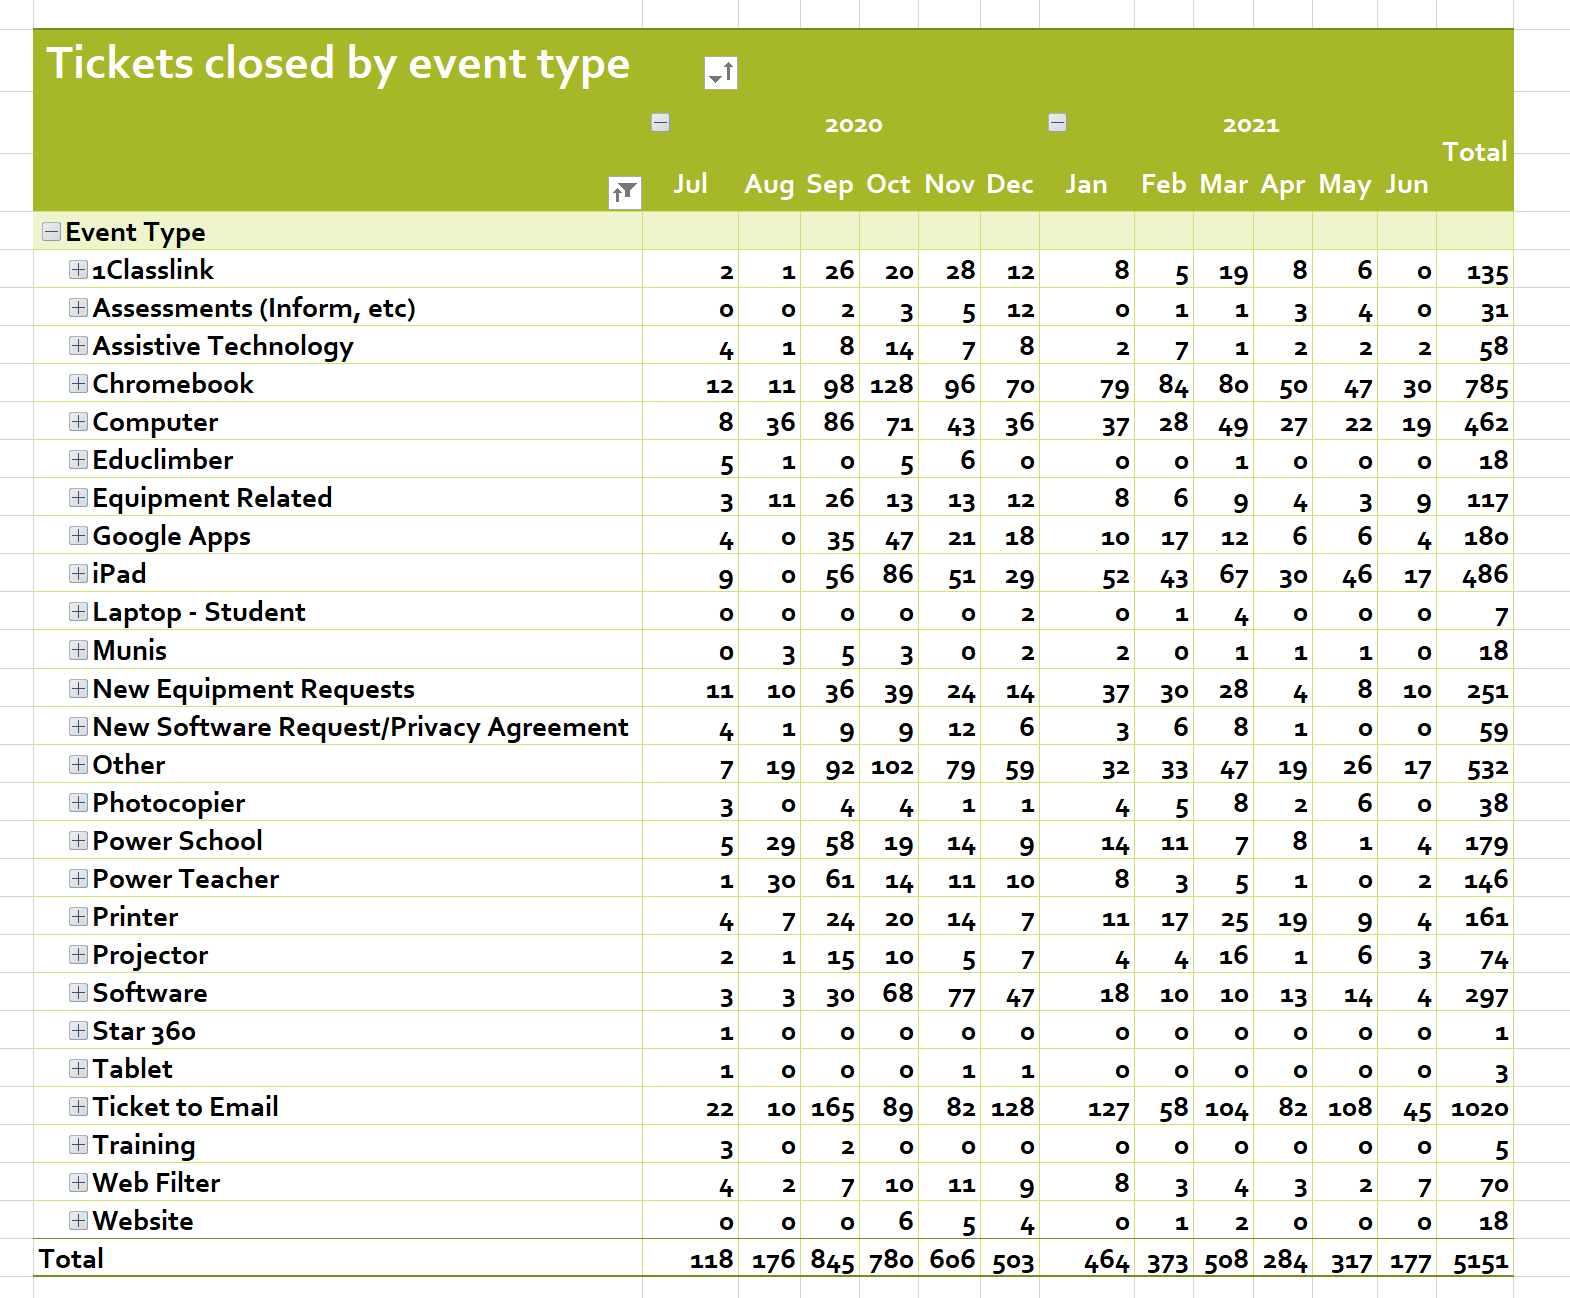
Tables – Tickets Closed by Event Type
Presents the number of tickets closed each month by the different event types.
By clicking on the event type, it shows further breakdown of tickets closed by event area and definition.
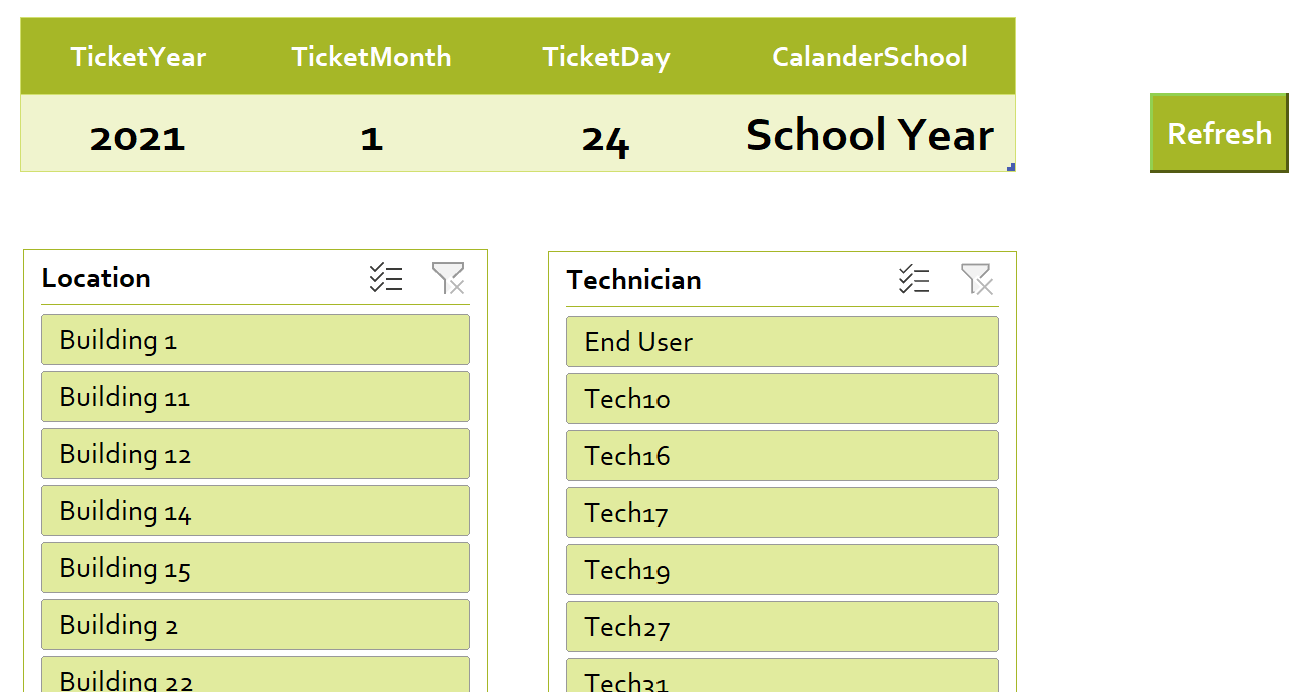
Filters
When you open the Dashboard, it will automatically update to the current date. Should you wish to change the date for the dashboard click on the Filter tab.
You can modify the Year, Month, Day (This should be set to the Sunday of the week you wish to view), School Year (Jul-Jun) or Calendar (Jan-Dec).
Press the Refresh button to update the Dashboard using your modified dates.
You can also filter out Locations and Technicians from the Dashboard.
Click on the different locations and technicians that you wish to have contained within the Dashboard results.