Knowledge Base Reports
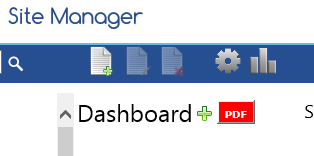
Click the bar chart icon to display the Knowledge Base Dashboard. The dashboard provides information on your knowledge base articles and how users are interacting with the knowledge base.
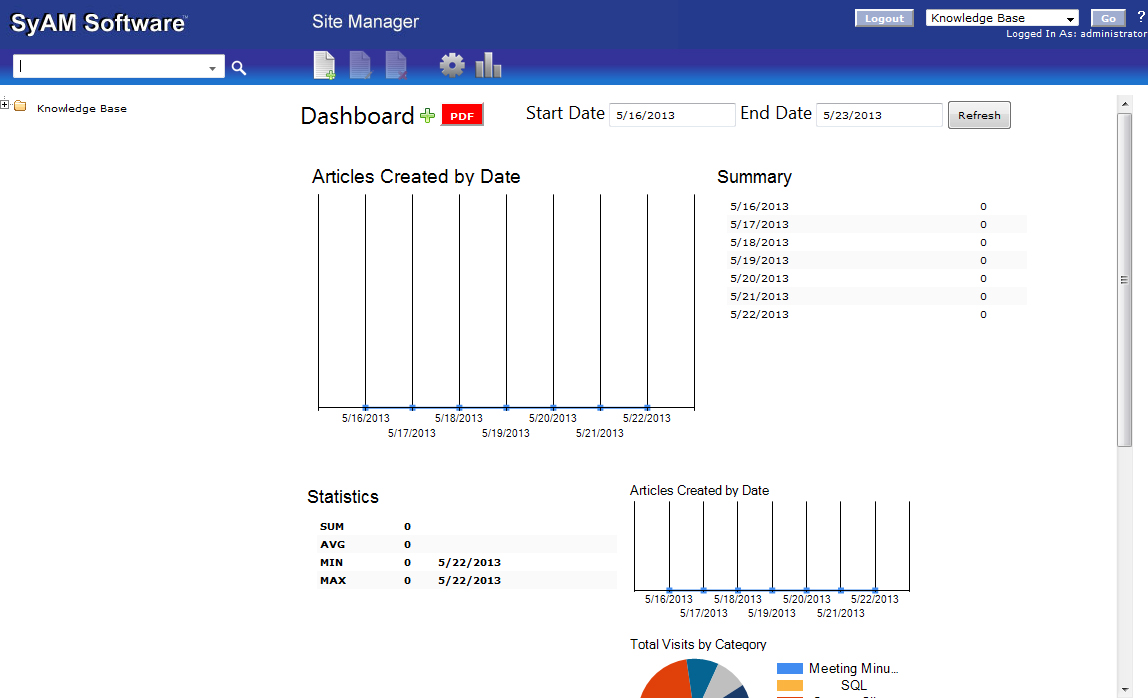
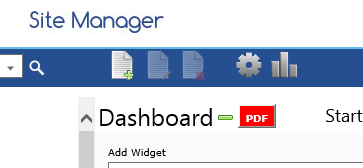
To add a widget to the dashboard, click the green plus sign.
A drop down menu of available widgets will be displayed. Select a widget and click the plus sign to the right of the drop down menu. The widget will be added to your dashboard.
Available widgets include:
- Articles Created by Author
- Articles Created by Date
- Articles Waiting Review
- Count of Articles by Category
- Top Ten Articles by Views
- Total Visits by Category
- Total Visits by Date
- Unique Visits by Category
- Unique Visits by Date
Click the minus sign to hide the widgets menu.
Clicking a widget in the dashboard displays that widget at a larger size at the top of the dashboard.
To remove a widget from the dashboard, mouse over the widget, then click the red X that appears at the top right corner of the widget.
You can change the date range for the analytics displayed by the dashboard. Click in the Start Date or End Date box and select the day from the calendar. Click the Refresh button to apply the chosen dates to all widgets.
Click the red PDF button to create a PDF document that contains all the widgets in your dashboard.