Dashboard
- Dashboard
The Dashboard provides the user with a chart showing the state of their managed systems. It displays the systems by the chosen grouping and (optionally) displays the last ten events that have occurred.
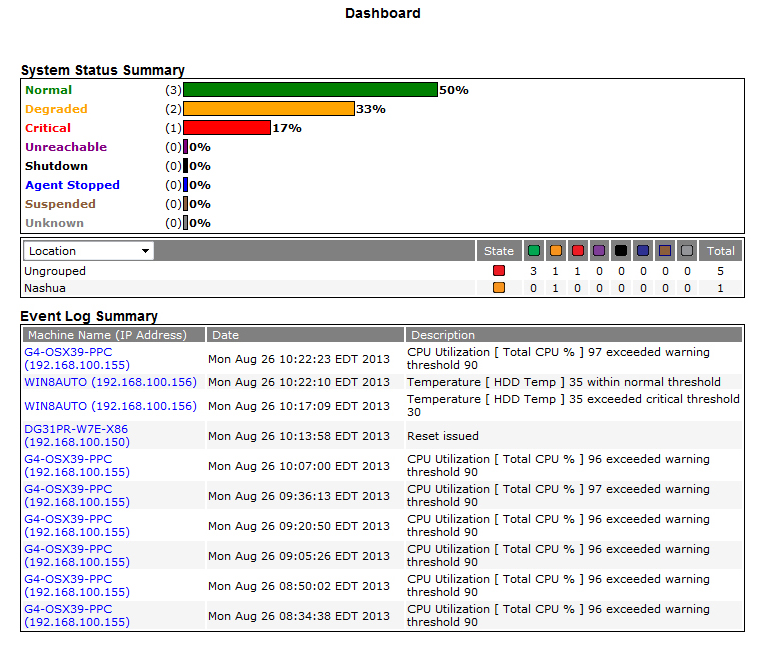
You can change the view of the system status summary by clicking on the down arrow and selecting the appropriate logical group.
To sort the management tree to display only a specific set of systems click on the status chart or the column and it will refresh the management tree with that filter by status.
Enabling the Event Log Summary option displays a list of recent events. Each entry has a Machine Name link to display system information.
The Dashboard will automatically refresh every 5 minutes.
You can configure the dashboard refresh time and can enable/disable showing the event log summary by editing the file syam.properties which is contained in this folder:
C:\SyAM\Jetty\syam\webapps\root\WEB-INF\
tree_refresh=15 Number of minutes between tree refreshes. This modification requires the SyAM Web Server service to be restarted
dashboard_refresh=5 Number of minutes between dashboard refreshes. This modification requires the SyAM Web Server service to be restarted
showDashboardEvents=false By changing this to true the event log summary will be shown. This modification will take immediate effect and does not require the SyAM Web Server service to be restarted.