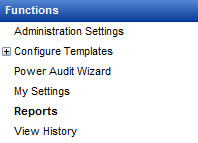
Reports
Reports
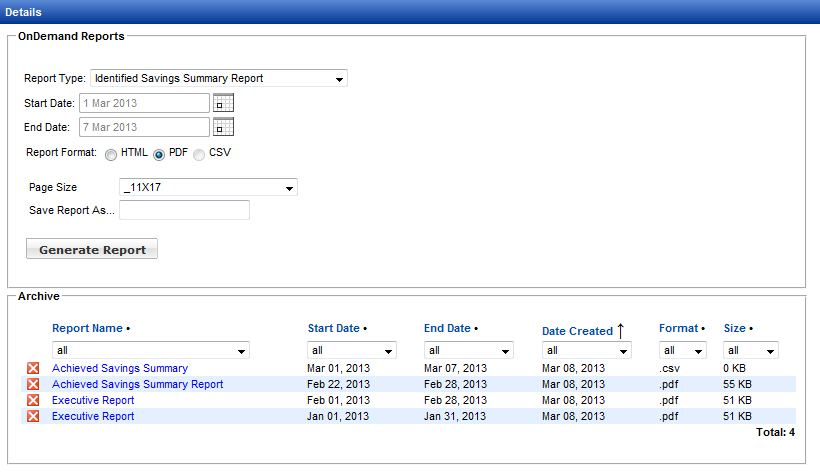
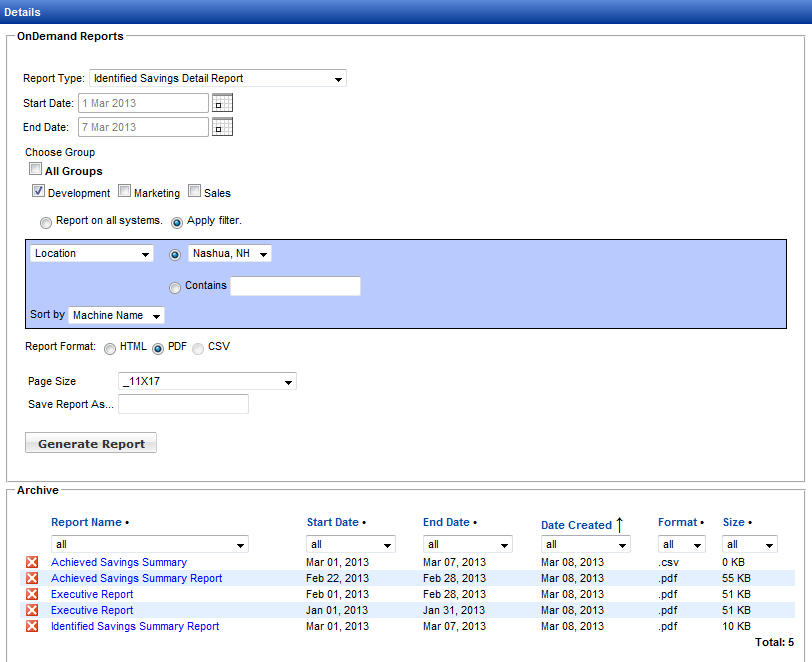
Power Auditor can produce HTML or PDF reports on demand. PDF reports are stored in an archive, named either by Report Type or by the text entered in the Save Report As field. Page size for PDF reports can also be set; choose the default size on the Report Settings tab of Administration Settings. Available report types include Identified Savings (potential cost savings based on audit data) and Achieved Savings (actual savings from enforcing power settings with Management Utility power templates). Both summary and detail reports can be generated for these report types.
When Power Auditor is in Identified Savings mode, these reports are available:
- Identified Savings Summary Report
- Identified Savings Detail Report
- Devices Powered Off Detail Report
- List machines with agent but no power template
- List machines without agent installed
- Devices Not Powered On
When Power Auditor is in Achieved Savings mode, the following additional reports are available:
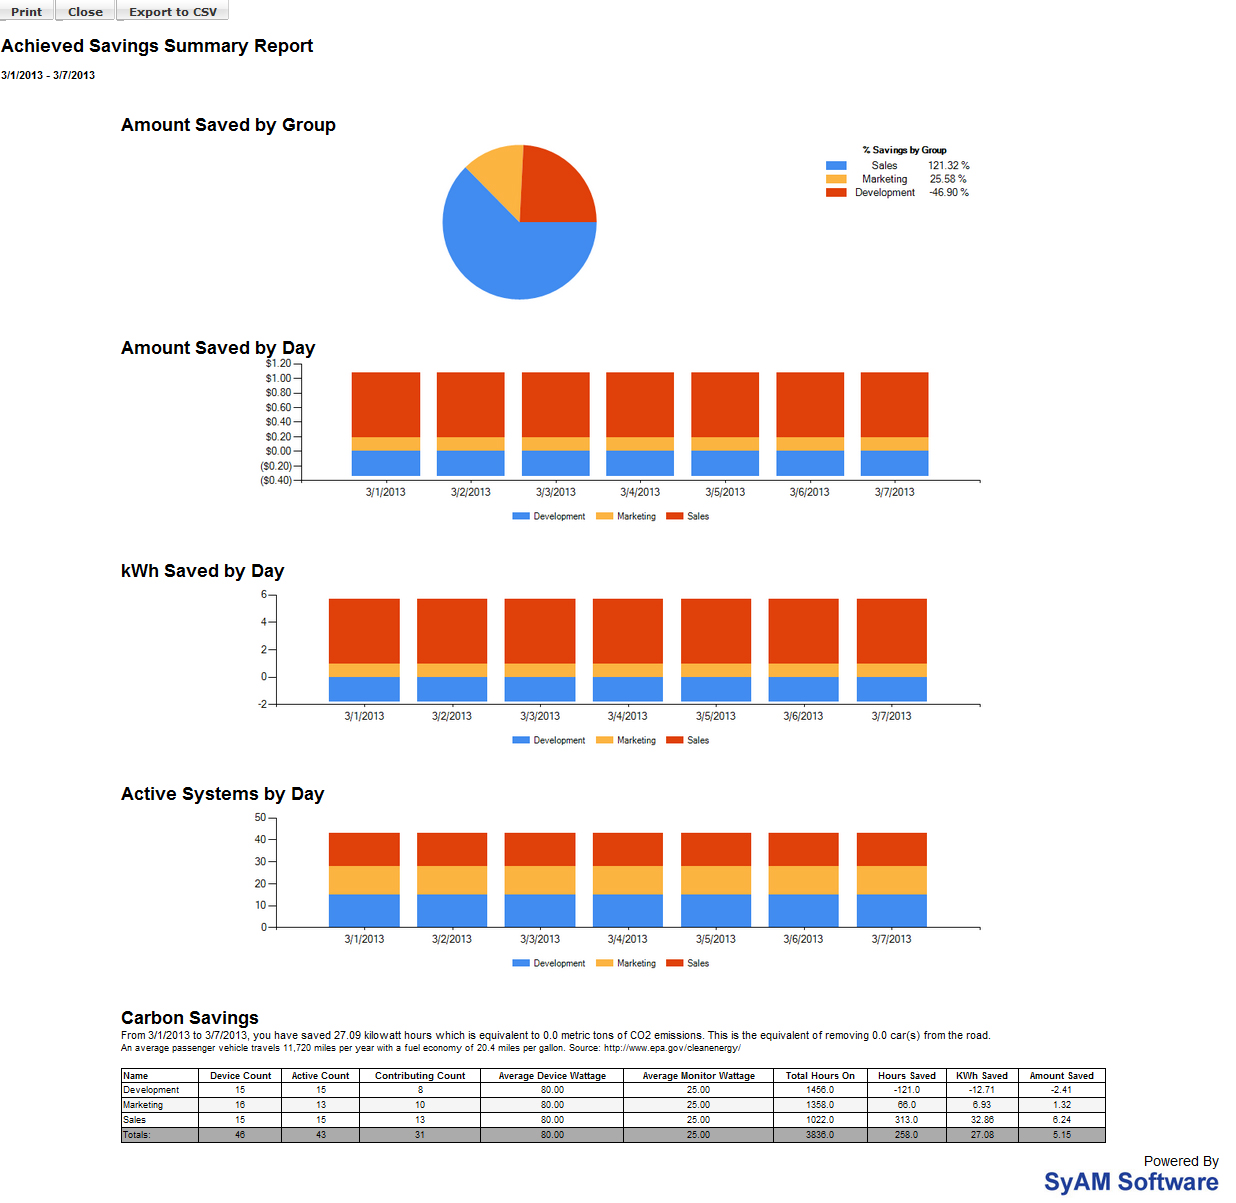
- Achieved Savings Summary Report
- Achieved Savings Detail Report
- Executive Report
Achieved Savings Summary Reports and Achieved Savings Detail Reports can be exported to comma-separated values (CSV) files which can be opened by a spreadsheet application. The CSV option can be selected when the report is created; there is also a button in the HTML report that will perform the export to CSV. The CSV reports are stored in the archive in the same way as PDF reports.
Detail reports include information on individual machines in the group(s) reported on. For detail reports, check All Groups to produce a report for all groups, or check one or more individual groups. You may also choose to filter results. Click the Apply Filter radio button to configure filtering options.
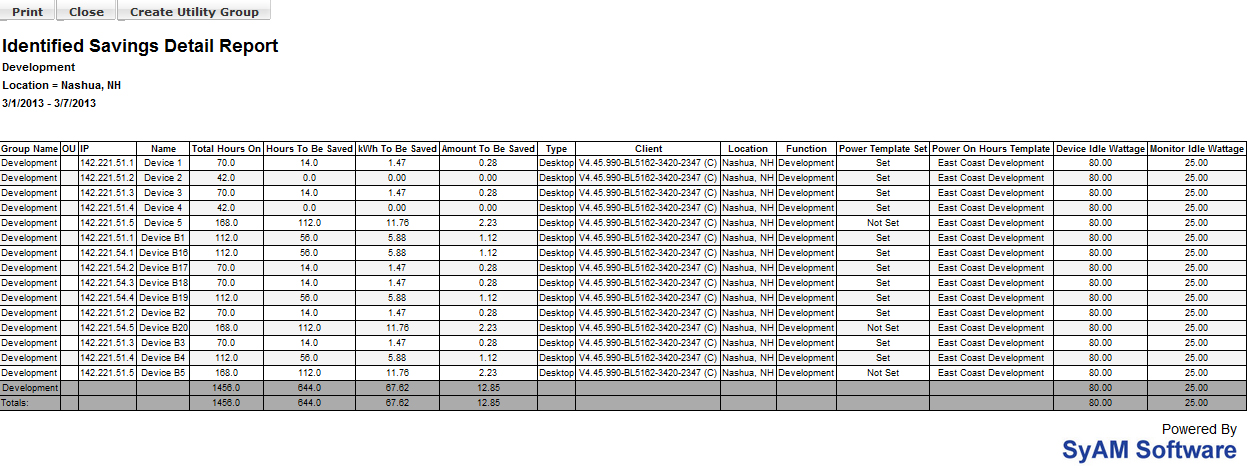
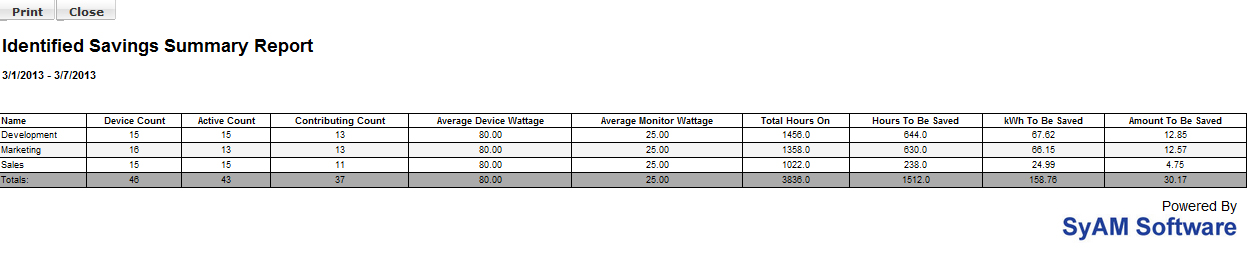
Identified savings reports, both on-demand and email, contain the following information (per group and totals):
- Name: The name of the Power Audit group
- Device Count: Total number of systems in the group
- Active Count: The number of systems that reported powered on status at any time during the reporting period
- Contributing Count: The number of systems that contributed to identified savings, that is, they were powered on for more hours than specified by the Power On Hours template
- Average Device Wattage: System power consumption as specified in the Power On Hours template
- Average Monitor Wattage: Display power consumption as specified in the Power On Hours template
- Total Hours On: Number of powered on hours for the entire group during the reporting period
- Hours To Be Saved: Number of powered on hours outside those specified by the Power On Hours template
- kWh To Be Saved: Total potential power saving for the group, based on wattages and hours calculated
- Amount To Be Saved: Total potential dollars saved for the group, based on kWh savings calculated and cost per kWh specified in Administration Settings
In Identified Savings mode, actual powered on hours are compared to the desired hours as defined in the Power On Hours Template. When we move into Achieved Savings mode, we are comparing the actual powered on hours with the baseline of data that was collected during the Identified Savings period. So there are some differences in achieved savings reports:
- Contributing Count: The number of systems that contributed to achieved savings, that is, they were powered on fewer hours than the baseline average
- Hours Saved: Number of powered on hours saved through power management, compared with the baseline data
- kWh Saved: Actual power saving for the group, based on wattages and hours calculated
- Amount Saved: Actual dollars saved for the group, based on kWh savings calculated and cost per kWh specified in Administration Settings
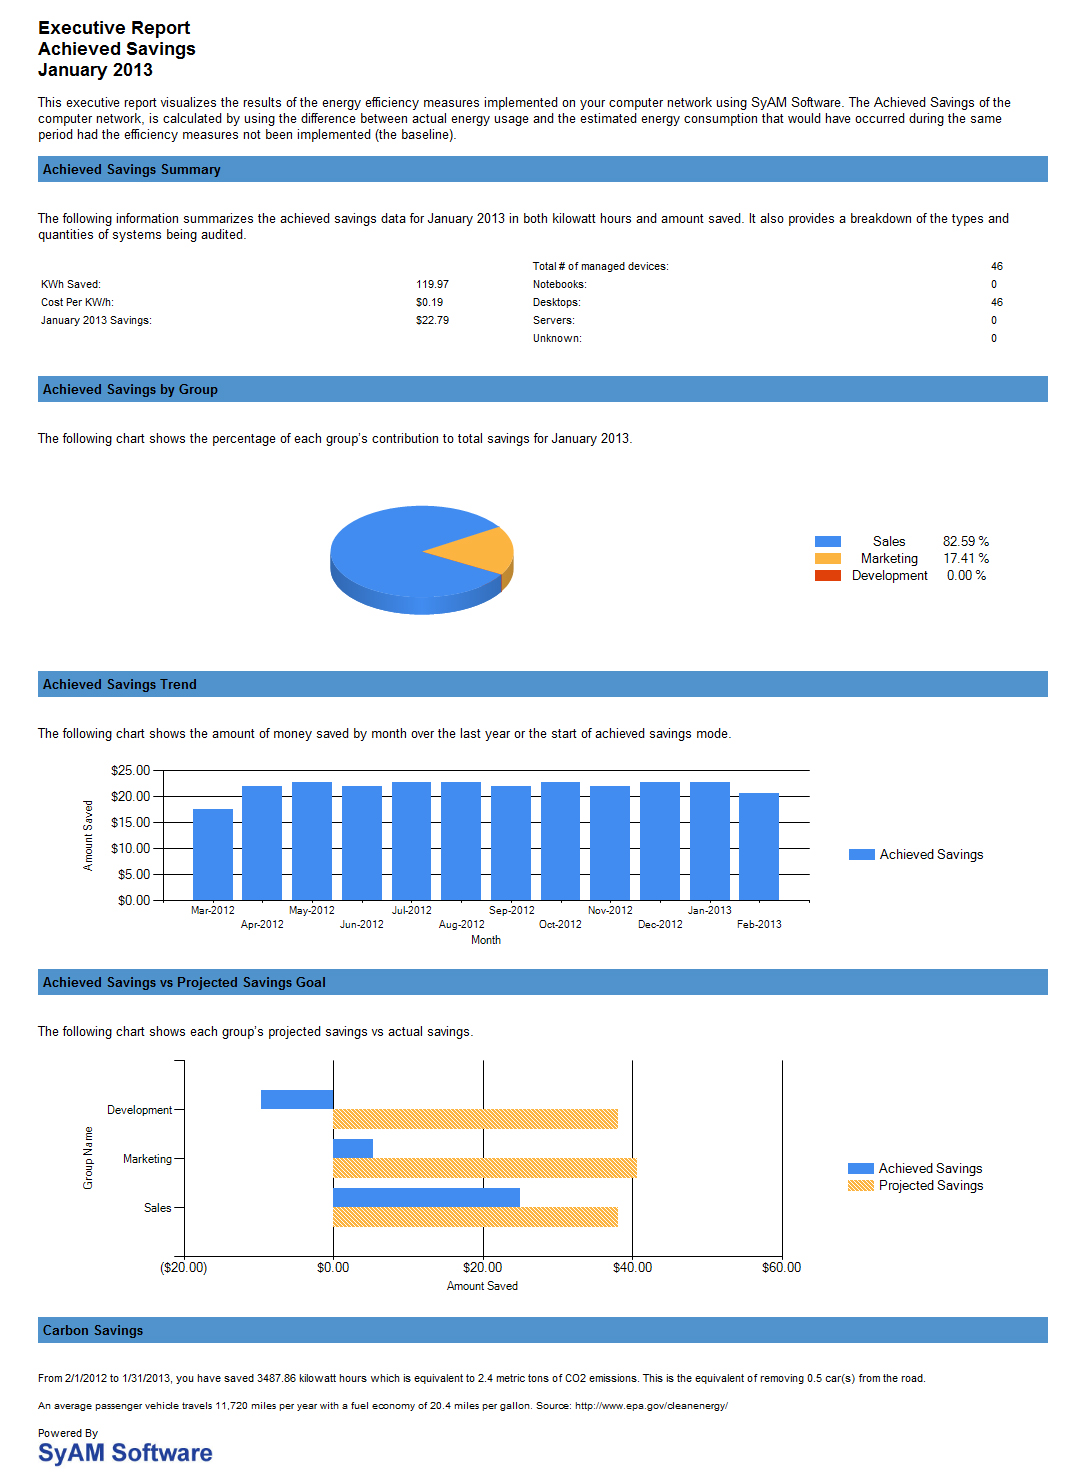
- Amount Saved by Group (pie chart)
- Amount Saved by Day (bar chart)
- kWh Saved by Day (bar chart)
- Active Systems by Day (bar chart)
- Carbon Savings summary
Other available reports include the Devices Powered Off Detail Report. This report summarizes by group the number of active devices (devices that have been powered on) and the number of devices powered off for each day in the date range. A detailed breakout of each day follows the summary, listing the active devices and whether or not they were shut down before midnight. The Devices Not Powered On report lists all devices, by group, that have not been powered on between the start date and the end date. If a device is powered on at any time during this period, it will not be listed on the report.
Reports can also be produced that list machines that do not have the agent installed, or machines where the agent has been installed but no power template has been set.
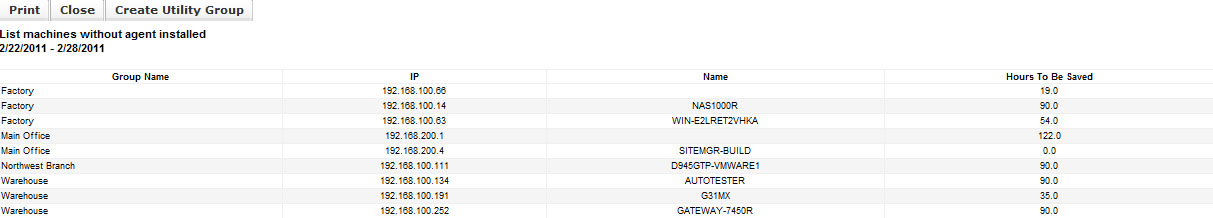
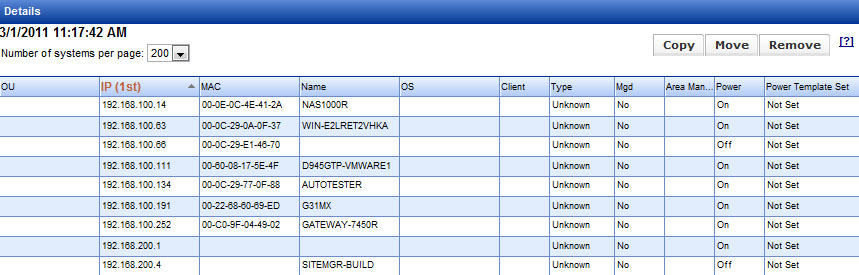
For these two report types, and for all the detail reports, clicking the Create Utility Group button will copy the listed machines into a Management Utility group identified by the date and time of creation. The groups can then be used for deploying the agent and the desired power settings.
The Executive Report becomes available in Achieved Savings mode. Like the Achieved Savings summary and detail reports, it does not appear in the menu while you are still in Identified Savings mode. The Executive Report summarizes achieved savings results for the selected month and year, displaying savings by group, the trend in amount of money saved, how achieved savings compares with projected savings, and a summary of carbon savings for the month. It can be produced in HTML or PDF format.