Charts
Power Charts
Charts enable the graphic representation of the Power Audit data to be presented on the dashboard.
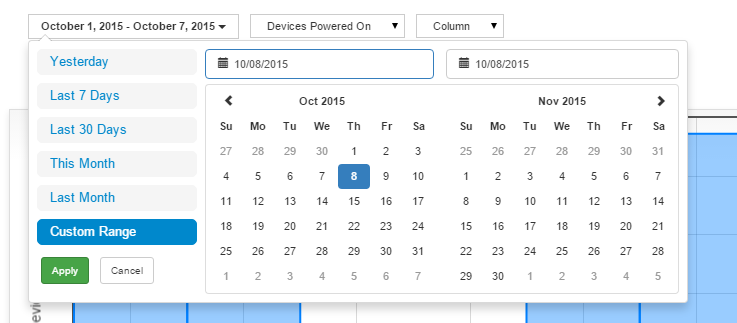
Select the date range for the chart
Select the Chart data
Devices Powered on
Kw/H Use
Identified / Achieved Savings (This depends upon the mode you are in)
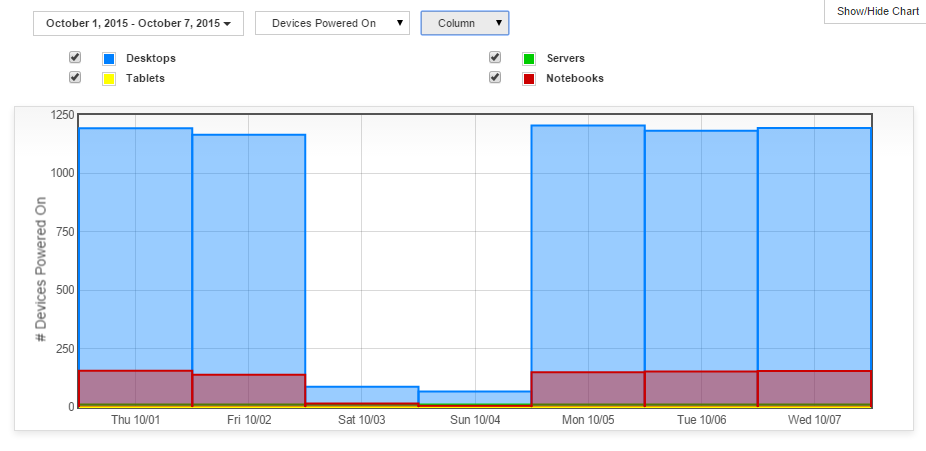
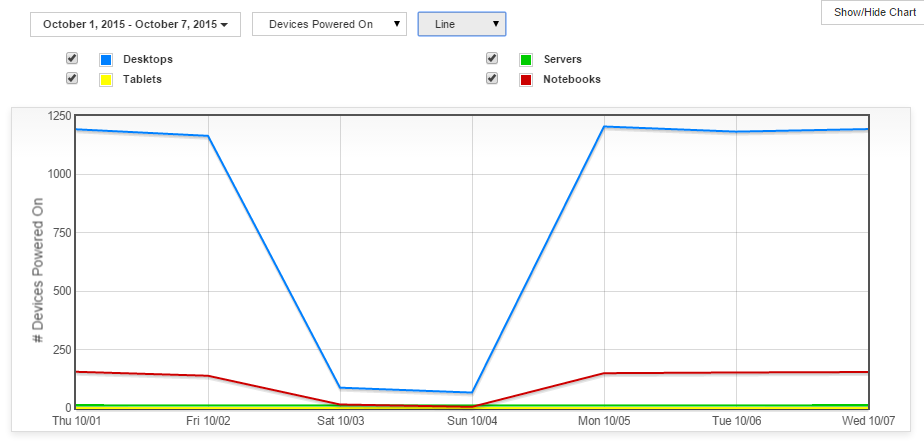
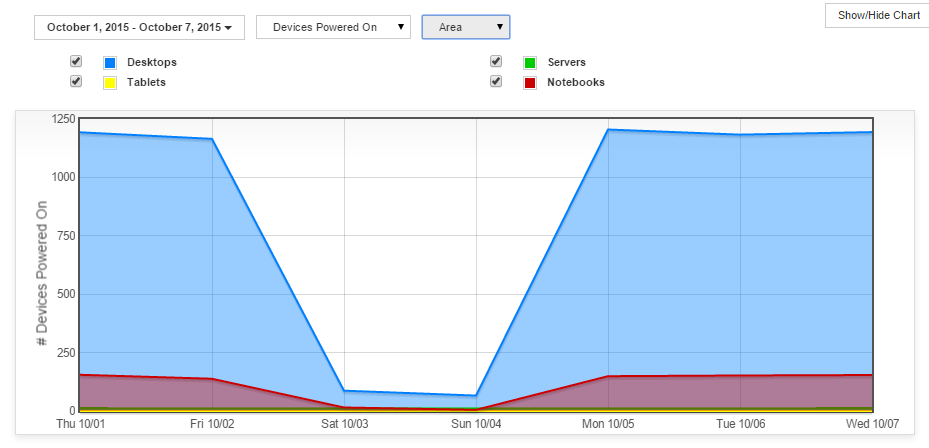
Select the Chart type - there are three options line, area and column
Line
AREA
Column