Asset Reports
Asset Reports
To access Asset Reports click on the chart icon  from the Asset Management Dashboard
Asset Reports are generated on-screen in real time, taking into account your filter settings. You can view the reports directly on the screen.
In addition, you have the option to export the reports to either PDF or CSV format. This allows you to save and share the reports in a portable and easily accessible format for further analysis or documentation purposes.
Report Settings
The reports offer three customizable settings: Category, Compared to, and Chart Type.
Category: You can select the specific category or asset grouping for which you want to generate the report. This allows you to focus on a specific subset of assets or asset attributes.
Compared to: This setting allows you to choose a reference point or baseline for comparison within the report. You can select a specific time period, another category, or a predefined benchmark to compare your asset data against.
Chart Type: You have the flexibility to choose the type of chart or visual representation that best suits your reporting needs. This could include options such as bar charts, pie charts, line graphs, or other relevant chart types.
By customizing these settings, you can generate reports that provide insightful analysis and visualization of your asset data based on the selected category, comparison criteria, and chart type.
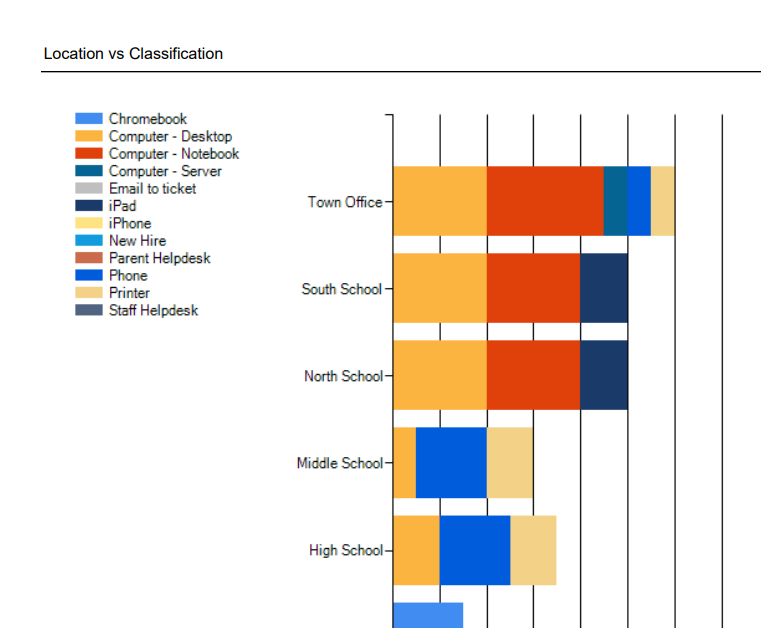
In this example we are reporting on Asset Categories by each Location in a Stacked Bar Chart

Exporting the report to PDF
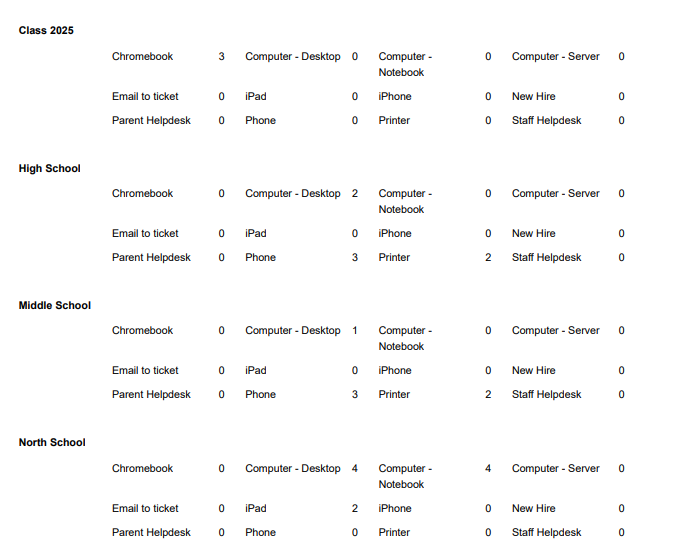
The PDF report presents the chart and the tables
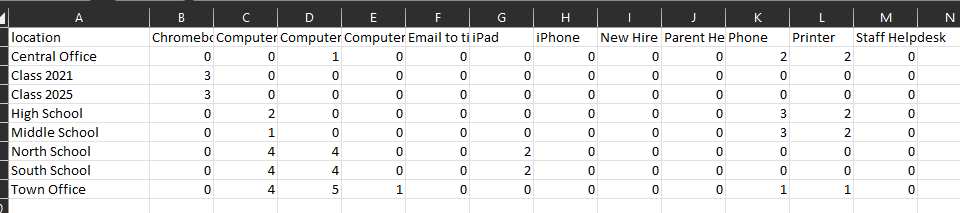
Exporting the Report to CSV
The CSV report presents the data in table format.