Configuring Alerting
System Area Manager provides the ability to configure alerts at individual system and central levels.
By using the Area Manager, users may configure thresholds and sample/reset periods for each monitored resource. Several notification methods also become available, such as via SNMP Traps or Operating System Event Logs.
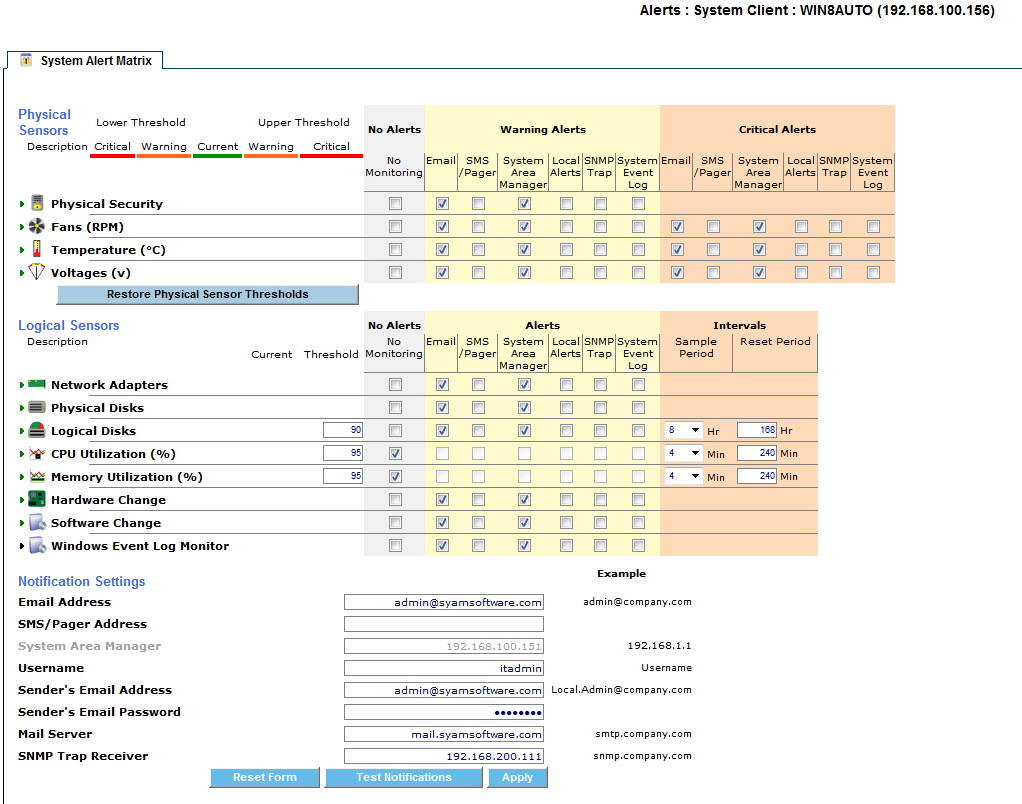
System Alert Matrix – System Level Alerting
The System Alert Matrix provides a detailed, color-coded view of the status of all monitored components in a specific managed system.
Settings such as notification methods, thresholds, and sample periods for each sensor type category are automatically applied to all discovered sensor instances of that type.
Physical Sensors
|
|
Security – If/when the system chassis is opened, the intrusion will trigger a sensor alert, provided that the connected board/BIOS support this information reporting. |
|
|
Fans – Monitored for rotational speed provided the fan is connected to a board/BIOS that supports the information reporting. |
|
|
Voltages – Monitored for the functionality that the connected board/BIOS supports. |
|
|
Temperature – Monitored for the functionality that the connected board/BIOS supports. |
|
|
Thermal Controlled Fans – Monitored for rotational speed and alerts when the CPU Temperature exceeds the defined threshold and the fan is not spinning. Provided for a defined set of motherboards supporting this feature. |
|
|
Wattage Utilization – Monitored for power consumption, provided that system hardware supports this information reporting. |
|
|
Redundant Power Loss – Monitors IPMI managed servers and alerts upon when redundant power systems lose their redundancy |
- Logical Sensors
|
|
Network Adapters – Monitors Ethernet operational state. |
|
|
Physical Disks – Monitors the presence and percent usage of a physical disk in the system and/or a RAID Set available to the operating system through a RAID controller. |
|
|
Logical Disks – The percent of capacity used by the logical disk formatted and mounted by the operating system is reported. If the disk has not been formatted, it will be reported as a failed disk. Removable Device – Removable devices that are represented to the operating system will be reported as mounted as long as they are present in the system. |
|
|
Managed RAID Controller – RAID Controller health. |
|
|
Total CPU utilization – Percentage of CPU usage. |
|
|
Total Memory utilization – Percentage of Physical and Virtual Memory usage. |
|
|
Memory Error Rate – Number of Single- and Multi- Bit errors that have occurred (requires ECC memory and support by the server board) |
|
|
Hardware Change – Monitors changes to system hardware configuration. |
|
|
Software Change – Monitors changes to installed programs. |
|
|
Service Monitor – Monitors state of a system service. |
|
|
Process Monitor – Monitors state of a process. |
|
|
Windows Event Log Monitor – Monitors file size of a Windows event log. |
When a system is managed from the System Area Manager, it enables users to modify any of the thresholds, sample periods, reset periods, and notification methods. It also enables alerts to be sent via the other notification methods such as SMS/pager, Local Alerts, SyAM System Area Manager central alerting, SNMP Trap, or writing the event to the System Event Log. (Note this System Event Log means events will be written to the local Windows Event Log or Linux syslog.)
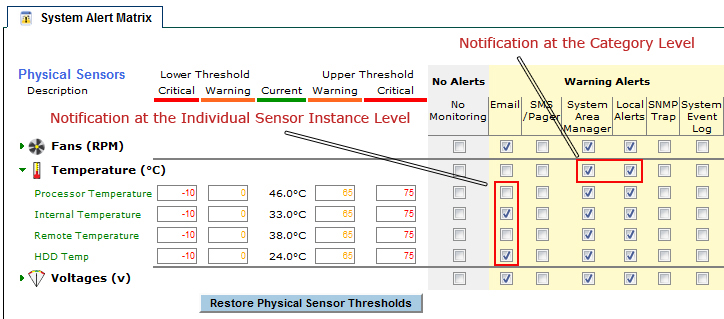
Clicking on each sensor category tree expands it to reveal all instances in the category. To select an entire category of sensors for the alert, click on the bolded category header. To select individual instances, click on the appropriate boxes for each instance.
Each sensor category provides the default notification options, thresholds, sample periods and reset periods that will automatically be applied to newly discovered sensor instances within that category.
- Disabling Notifications
If you wish to disable notifications for a specific senor or sensor category you can do this by clicking on the No Monitoring check box.
This disables the sensor instance or sensor category from having any alerts notified, thus they will not be monitored or be represented in the health state of that sensor category.
- Physical Sensor Upper and Lower Thresholds
Each physical sensor instance has its own range of safe operating values with lower and upper warning and critical thresholds. These values are discovered if the hardware platform supports that information, or are calculated from available data.
- Physical Sensor Warning and Critical Alerts
Since physical sensors may enter warning or critical health states, separate alerting methods may be configured for each.
- Logical Sensor Thresholds
Monitored resources that are not physical sensors are called "Logical Sensors". Each instance of the logical sensor types Logical Disk, CPU Utilization, and Memory Utilization, has a utilization threshold.
- Logical Sensor Warning Alerts
Logical sensors, by design, may enter the warning health state but not critical. So there is only a single set of alerting methods available.
- Sample Period
CPU and Memory Utilization are gathered several times over a period of time, so that transient spikes are not reported. This time period is configurable by the administrator, and is known as the sample period. The pre-set sample period options are from 4-8 minutes. If 80% of the gathered readings exceed the threshold, a transition to warning state occurs.
The sample period for an instance of Logical Disk that is a removable device (floppy or CD-ROM drive) is similar to that of other sensors. A set of four readings is gathered during the sample period. If the device (floppy disk or CD) is present through all of them, a transition to warning state occurs.
- Reset Period
When a logical sensor transitions to a warning health state, an event is raised and alerts are sent according to the Warning Alerts settings. The reset period is the amount of time during which no additional alerts will be issued after the initial alert.
- Removing a Sensor Instance from the System Alert Matrix
When a sensor instance, such as a specific logical or physical disk, has been removed from the system, or has otherwise entered a critical state, it is displayed in red and an "X" appears next to it. Click on the "X" to permanently delete this sensor instance from the alert matrix. Only do this if the instance is not being replaced. Once the sensor has been replaced it will automatically be monitored and the new health state will be represented.
- Hardware and Software Changes
Alerts can be generated whenever the system hardware or software configuration is changed.
- Service, Process, and Event Log Monitors
Monitoring of system services, processes, and Windows event log files can be configured on the system’s Software tab.
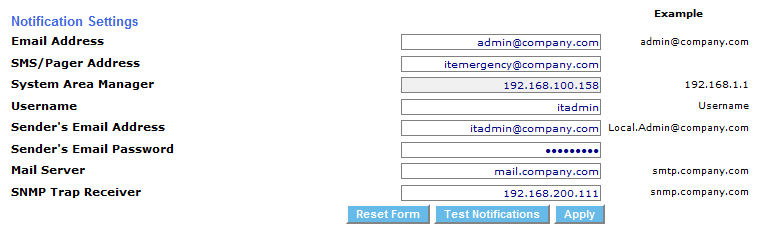
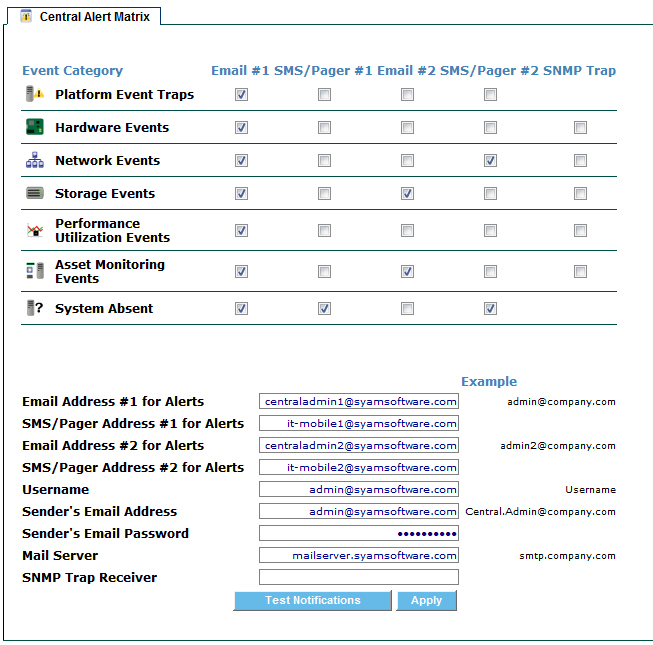
Enter the destination email address, the sender's email address, and the mail server hostname or IP address. Enter the username and password if outgoing email is authenticated. Click the Apply button to save changes. Use the Test Notifications button to send a test email, and ensure your configuration is correct.
Enabling Local Alerts in the System Alert Matrix causes a tray icon to be displayed, and popup windows to appear, on the managed system when an alert is generated.
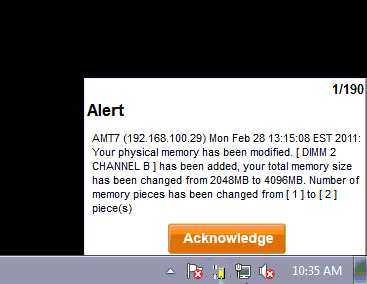
Alerts are categorized as asset monitoring events, hardware events, storage events, network events, and performance utilization events.
The user is prompted to acknowledge each alert. When the administrator generates a Local Alert report, each alert shows whether it has been acknowledged, and by which user.
The Central Alert Matrix is accessed from the drop down menu on the header bar. It provides the ability to configure the appropriate notification options for events that are sent to this System Area Manager from all of the systems it is managing.
Notifications can be configured to be sent via email or SMS/Pager and can be assigned to administrator one or two for each type of event, in addition to sending SNMP Traps.
Types of monitored events
|
|
Platform Event Traps PET's – PET 1.0 formatted SNMP traps received are converted to plain text and alerted upon. |
|
|
Hardware Events – When a threshold is exceeded by a physical component within the system. Hardware Events include: physical chassis security, fan speed variation, chassis temperature fluctuation, voltage fluctuation or power redundancy loss |
|
|
Network Events – Network connectivity is lost due to an adapter failure. |
|
|
Storage Events – A logical disk has reached its utilization threshold, a logical or physical disk is lost (removed or not functioning), or a removable disk has remained present on the system for an extended period of time and may cause boot up issues. |
|
|
Performance Utilization Events – CPU or memory utilization threshold has been exceeded. |
|
|
Asset Monitoring Events – Server System Client records an inventory of the system components being monitored (i.e. CPUs, Memory, Disks, Software applications installed or removed, etc), and compares it each time the system is booted. Any discrepancy in the information when the agent is started is reported as an asset-monitoring event. |
|
|
System Absent Events – When the System Area Manager is no longer able to communicate with a managed system, it is reported as being absent, unless it was correctly shutdown. |
Central Alert Matrix can be configured based upon your notification requirements.
The Central Alert Matrix uses configurable SMTP email server settings. By default SMTP uses port 25 and does not use SSL. These settings can be modified as needed to support other SMTP email servers such as Gmail that uses SSL and port 465. To modify these settings, on the server running System Area Manager, stop the services SyAM Software System Area Manager Web Server and SyAM Software System Area Manager Central Manager. Edit the file syam.properties located in the c:\syam\jetty\syam\webapps\root\web-inf folder. When finished editing, restart the services.
Default setting
smtp_port=25
ssl=false
Gmail setting
smtp_port=465
smtp_ssl=true
Not reporting IP Address in Alert Email
You can modify alerting not to include the IP address in the alert email of the system by changing the value for notificationsDisplayIp from true to false.
- System Area Management (SyAM) MIB
The SyAM MIB must be installed into the Enterprise Framework server before it can decipher traps sent from a managed system.
Please consult your Enterprise Framework application on how to install a 3rd party MIB.
The MIB file is available for download from the SyAM website.
System Area Management (SyAM) Integration into Microsoft System Center Operations Manager 2007/2012 (SCOM)
The SyAM Management Pack for Microsoft System Center Operations Manager must be imported into the SCOM server, before it can decipher Windows events written by SyAM Management Agents. Please consult the SyAM Software Tool Tip “Using the SyAM Events Management Pack” for instructions on installation and configuration.
The SCOM 2007/2012 Management Pack file is available for download from the SyAM website.